

Before having customer conversations, you'll need correct info. Click here to discover two Numerik sales metrics which can help drive your sales: Revenue $ Swing and Revenue % Swing.
If you want to drive your sales, you’ll want to make decisions based on useful sales metrics: that way you can enter customer conversations armed with correct info, ready to ask the right questions. Thankfully, if you’re a Numerik user, these sales metrics aren’t out of reach, it’s simply a matter of choosing the right metrics for the right situation. In this blog, we’re looking at key metrics sales reps can use to drive their sales performance: Revenue Swing $ and %. We’ll break down what these two sales metrics can reveal about your customer’s spending, and how you can utilize their insights to drive your customer conversations.
We’ll look at 5 ways you can use Revenue Swing $ and % to drive sales performance, but first, let’s look at what these two sales metrics are, and why they’re important.
Revenue Swing $ and Revenue Swing % are sales performance tracking metrics based on showing the differences between your revenue for the current period, and the revenue earned for the same period last year. Expressed as a growth or decline in dollars or as a percentage, sales reps can quickly use these two sales metrics to see where there could be sales opportunities, or where work needs to be put in to get sales performance back on track. Critically, the distinction between each metric is in how they show growth or decline for certain customers: Swing % is better for showing growth for small/medium sized customers. Revenue Swing $ and % can be applied to multiple data leaderboards, including customer data, product groups, and individual products, to show reps growth or decline trends at the levels which matter most.
Here’s how Revenue Swing $ and % look in the Numerik mobile app at the customer, product group, and product levels:
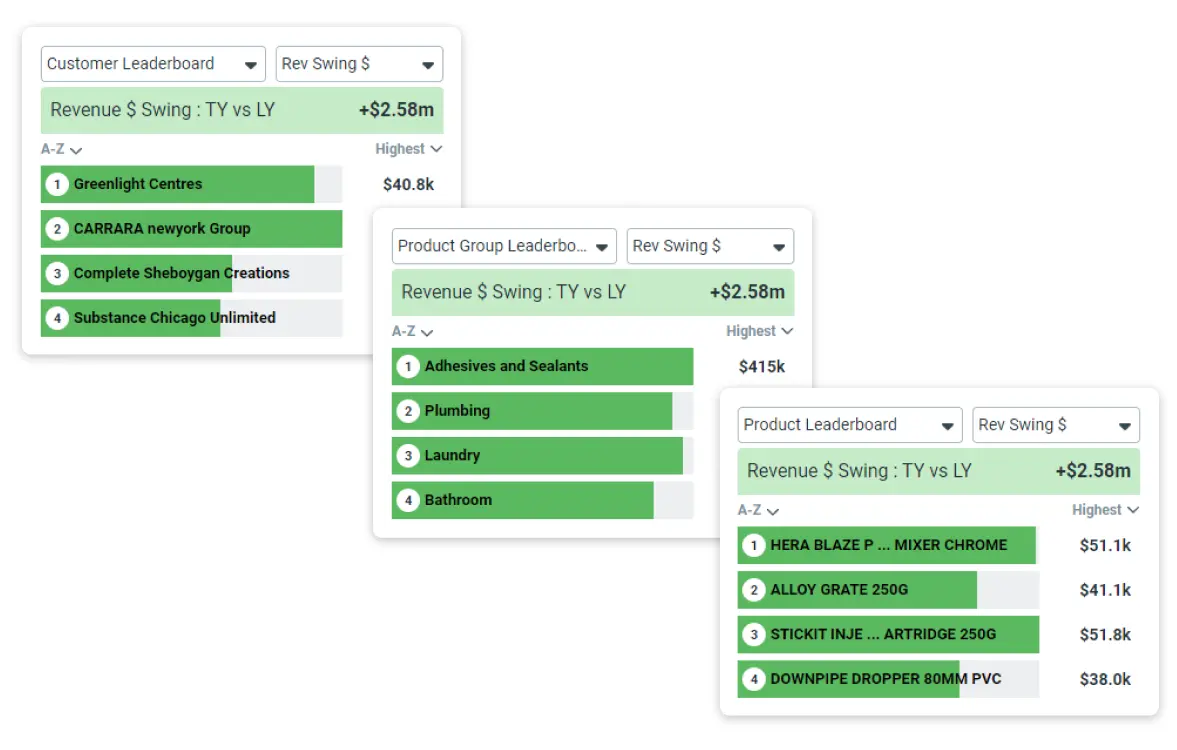
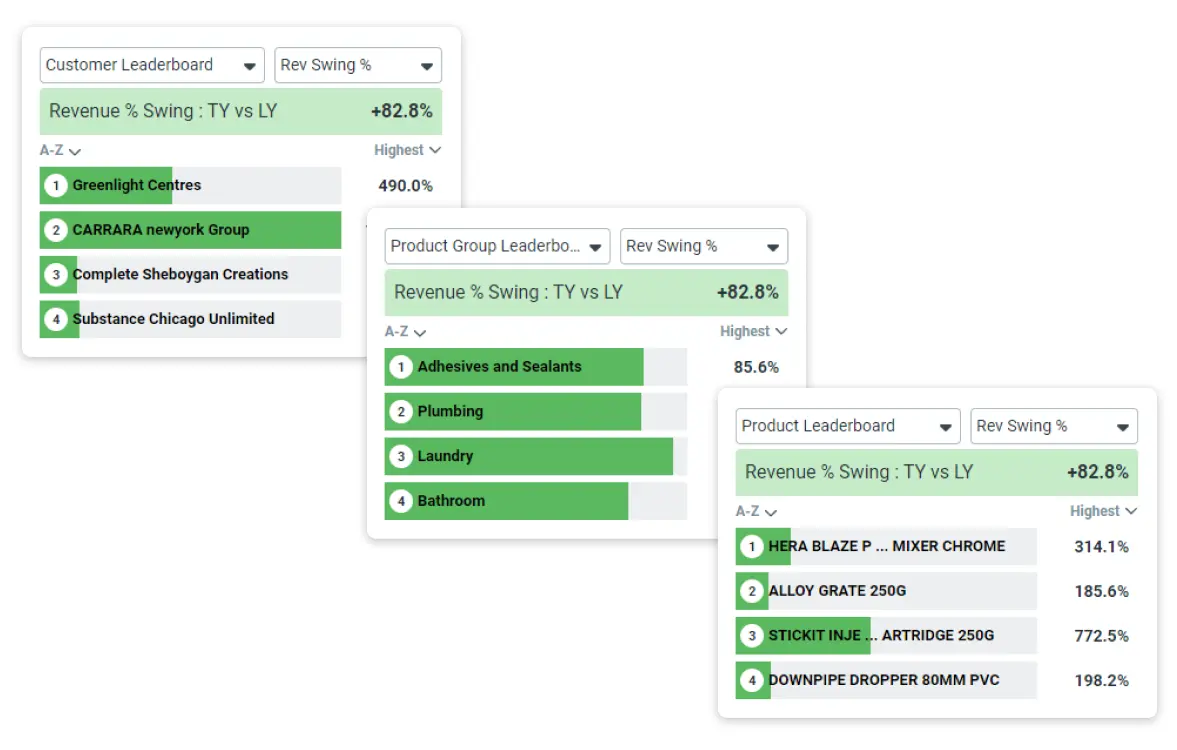
Revenue Swing $ and % are important because they show sales reps which customer, product groups, and products are experiencing change, allowing reps to take action without the admin. In a practical sense, Revenue Swing $ and % can act as troubleshooters: if there is a larger issue, a rep can drill down until they’ve found the problem’s root cause. From there, they can get in touch with their customers to ask them what’s been going on with their projects to cause said growth or decline.
For example, after looking at Revenue Swing $ and seeing a customer $3,000 behind vs last year, a sales rep can drill down into the product group level to see which groups have led to the decline. By going further, into the product level, the rep can see exactly which products have caused the decline. From that drilldown, the rep can start taking action, whether that be to book a customer meeting, have a phone call, or send an email. Perhaps the customer stopped buying a popular product as they’re facing a new problem. Could there be an opportunity to win back their business by recommending or cross selling the customer into a more suitable product?
Furthermore, unlike your conventional BI tool, sales reps don’t have to sift through data on their laptops to identify these growth trends at every level. With Numerik, Revenue Swing $ and % are updated by the minute and can be accessed straight from a phone in under 15 seconds.
To drive sales performance and start customer conversations, we recommend you get familiar with the following 5 points
In sales, there’s very little time to take action and customer sales performance can change quickly. Using Revenue Swing $ and %, sales reps can quickly see which customers, product groups, and products are behind year on year, without wasting time. Before you go, let’s re-cover the basics:
Want more information on how your sales reps can use Numerik’s sales metrics to drive sales? Click here to book a fully personalized demo. Alternatively, if you’re a current user looking for more help, don’t hesitate to message the customer team at support@numerik.ly.
.webp)


.avif)